Canadiens Analysis
Canadiens Stats: Top 5 & Bottom 5 Players In Important Statistics
With two thirds of the 2024-25 season in the books, it’s time to once again take a look at how the Montreal Canadiens are progressing based on their crucial underlying numbers. To do this, we will compare their year-to-year stats, as well as establish which players are helping or hurting the Habs in certain categories.
Last season the Canadiens ended the year with a .463 points percentage, which was 28th in the NHL. This season they’re running at a .491 points percentage, good for 24th. It’s an improvement, but perhaps not the improvement that many were expecting, especially after the strong push that saw them flirt with a Wild Card spot.
As it stands, the Habs are just three points up on the Seattle Kraken, connoting that a top-5 pick at the upcoming NHL Entry Draft is still a legitimate possibility.
Shot Share
The first statistic we’ll take a look at is shot share, which determines the percentage of shots on average controlled by a team throughout the year. For example, if there were 100 shots in a game, and the Canadiens had 53, they would have a 53 percent shot share. It’s more commonly known as Corsi For percentage, but that’s a terrible name for a statistic, so we’ll stick with what makes sense.

As you can see, the team enjoyed a relatively healthy bump, going from 29th in the NHL to 22nd this season. That may not seem like a lot, but it’s a significant uptick in a crucial statistic. If you control the shots, you have better odds of controlling the goals. And if you control the goals, well, you know what happens next.
It’s not a rule per se, but generally, teams that qualify for the playoffs tend to be among the top 15 teams in shot share, and teams that win the Stanley Cup are almost always among the strongest NHL teams in shot share. The Florida Panthers and the Edmonton Oilers, the two teams that met in the Stanley Cup final last year, were ranked 2nd and 3rd in shot share, respectively.
At the moment, the Canadiens’ top line is producing a very healthy shot share, whereas the second line has essentially collapsed, which lines up with Dach’s struggles this year. He went from one of the best to the worst, and adding Patrik Laine to the trio was a complete disaster, especially since Alex Newhook has the sixth-worst shot share on the team. It was like tying three stones together, throwing them in a river, and then expecting them to magically float.
MUST READ: How The Montreal Canadiens Can Avoid Benching Patrik Laine Again
Losing Emil Heineman was a lot more significant than expected, which has seeded a little chaos in the bottom-six. Jake Evans’ production immediately dropped, while the previous line combinations were ripped apart in a desperate attempt to renew some semblance of chemistry on the third and fourth line.
Fortunately, rookie Owen Beck has compensated for Heineman’s loss from a shot share standpoint. The production isn’t quite there yet, but we can safely say Beck helps the Canadiens keep the puck 200 feet away from their goalie, and that’s a blessing for any coach. His strong play also gives the Canadiens more options at the trade deadline, as they know there’s a player ready to absorb minutes in the system.
Top Shot Share Players: Owen Beck (58.1%), Jayden Struble (53.5%), Emil Heineman (52.4%), Alexandre Carrier (51.6%), and Nick Suzuki (51.5%).
Bottom Shot Share Players: David Savard (42.8%), Patrik Laine (43.2%), Kirby Dach (44.7%), Kaiden Guhle (46.9%), Josh Anderson (47.1%).
The next statistics we’ll discuss is HDCF%, or high-danger shot share. Not all shots are created equally, which is why we tend to focus on shots taken from areas on the ice that produce the most goals.
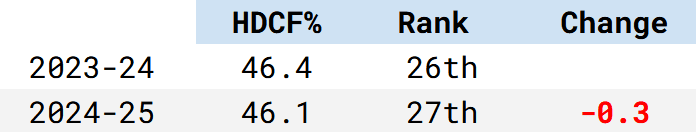
While the Habs have improved their shot share, they’ve actually taken a step back when it comes to high-danger chances. This has been a recurring theme since Martin St-Louis took over as head coach, and it’s getting worse.
Some of it has to do with personnel, such is life in a rebuild, but you never want to see a drop in high-danger shot share in year three of a rebuild.
The top line is improving, slowly but surely, however, there’s still a lot of work to be done in that respect. Until Cole Caufield and Nick Suzuki can produce a high-danger shot share that’s above 50 percent, they won’t truly establish themselves as a premiere top line in the NHL.
Fortunately, the former third-line (Anderson, Christian Dvorak, and Brendan Gallagher) did quite earlier in the season, which is why the team didn’t drop further down than 27th in the NHL.
Top High-Danger Shot Share Players: Brendan Gallagher (59.5%), Christian Dvorak (55.6), Josh Anderson (53.5%), Owen Beck (52.2%), Jayden Struble (51.1%)
Bottom High-Danger Shot Share Players: Patrik Laine (39%), Cole Caufield (39.7%), Nick Suzuki (41.1%), David Savard (41.6%), Juraj Slafkovsky (41.6%).
The next metric is xGF%, or expected goal share. This represents the probability the plays would result in a goal.

The Habs enjoyed a slight increase when it comes to their expected goals, but they also dropped one spot compared to every other NHL team. The biggest issue being their inability to control the quality chances throughout the season.
Once again, you want to see this number rise to above 50 percent before getting excited about the possibility of qualifying for the playoffs.
Top Expected Goals Share Players: Owen Beck (55.8%), Brendan Gallagher (53.8%), Christian Dvorak (52.3%), Jayden Struble (51.5%), Alexandre Carrier (51.2%).
Bottom Expected Goals Share Players: Patrik Laine (38.3%), David Savard (43%), Joel Armia (44%), Kirby Dach (45.2%), Juraj Slafkovsky (46.1%).
Save percentage is straightforward, it’s the percentage of shots the team has saved.
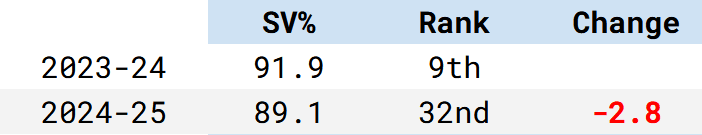
Last year, the Habs were among the top 10 teams in save percentage, while they’re dead last in the NHL this time around. The reason is rather clear, Cayden Primeau struggled mightily, producing an .824 save percentage at 5v5, a significant downtick from the .925 he had last year, which was the top save percentage among all the goaltenders.
Samuel Montembeault is running at .900, much lower than the .918 he had in 2023-24. The Habs do allow a ton of high-danger changes, and we’ll get to that soon, but the fact remains that Montembeault is not playing up to snuff compared to past performances.
Jakub Dobes is keeping the boat afloat thanks to his .915 save percentage, though we do have to note he’s only featured in nine games, which means the numbers are still at risk of changing dramatically if he has another good or bad game.
Dobes doesn’t even come close to allowing Rantanen to see net. Another great save. pic.twitter.com/Odek5eRaI9
— Marc Dumont (@MarcPDumont) January 5, 2025
High-danger save percentage is a refined version of save percentage, focusing on the saves made when shots are taking from high-danger scoring areas.

Here we see another drastic drop, and you’d be hard-pressed to suggest any of the goalies are doing well when it comes to saving quality chances.
Once again, it’s Primeau who suffered the biggest drop. He led all three goalies last year with an impressive .873 HDSV%, but only managed a .772 this season.
Both Montembeault and Dobes are sitting at an .810 HDSV%, which is tied for 59th in the NHL.
Suffice it to say, the Canadiens need to focus on both scoring and preventing high-danger chances, because it’s a continual drag on their overall performances.
Shooting percentage is simply the number of shots it takes to score a goal. For example, if a player scores every 10th shot, they will have a 10 SH%.

As you can see, there’s been absolutely no change in their shooting efficiency, one of the few constants for the Montreal Canadiens in the past two seasons.
There have been some changes from an individual standpoint, with Jake Evans scoring at an unsustainable pace, and Caufield finding his rhythm after a disappointing 2023-24 shooting season. It’s also worth pointing out both Heineman and Logan Maillouxare scoring on every fifth shot.
That being said, it’s quite clear the defencemen are struggling to score, though a low shooting percentage from the blue line is understandable, whereas you want to see the forwards pull their weight with more regularity.
Top Shooting Players: Emil Heineman (20%), Logan Mailloux (20%), Jake Evans (17.1%), Alex Newhook(14.8%), Cole Caufield (14%).
Bottom Shooting Players: Arber Xhekaj (1.8%), David Savard (3%), Mike Matheson (3.7%), Patrik Laine (4.8%), Lane Hutson (5.4%).
Bottom Shooting Forwards: Patrik Laine (4.8%), Christian Dvorak (6.7%), Joel Armia (6.8%), Josh Anderson (8.6%), Brendan Gallagher (9.3%).
All Montreal Canadiens statistics are 5v5 unless otherwise noted, via Natural Stat Trick.
The Montreal Canadiens players listed must have played at least 60 minutes of ice time at 5v5. This (arbitrary) cutoff eliminates Michael Pezzetta from the mix, which isn’t particularly fair toward the player, however, his ice time was so sporadic that it’s genuinely hard to get a good read on his performances. While he plays less than 6 minutes per game on average when he actually gets called-upon, his underlying numbers are quite good. They’re not sustainable by any means, but despite his penchant for taking untimely penalties, when Pezzetta is on the ice, the Montreal Canadiens outshoot their opponents by a wide margin (56.5 percent shot control, second among all Canadiens players).