Montreal Canadiens
Shane Wright’s Elite Underlying Numbers Should Comfort Canadiens Fans
Ever since the Montreal Canadiens won the NHL Draft Lottery, there has been a hot debate as to whether the projected 1st overall pick, Shane Wright, is deserving of the honour of being selected first in the 2022 NHL Draft. Much has been talked about his lack of offensive production or his perceived lack of intensity in the Ontario Hockey League, but his underlying numbers and the context of his season speak volumes as to why he deserves to go 1st overall.
To get a better view of Wright’s impact on the Kingston Frontenacs this season, Montreal Hockey Now teamed up with Elite Prospects‘ Director of North American Scouting, Mitchell Brown, to look at his tracking of the top prospects this side of the Atlantic. In his tracking, Mitch follows players shift-by-shift in order to track their efficacy in all aspects of the game, such as their shooting, passing, zone entries and exits, defence and expected goals involvement. Mitch then uses these findings to grade hundreds of prospects into a pool.
He then uses a Z-score, which shows how a given player performs compared to the average of the group. A positive Z-score, which is coloured in shades of blue, indicates a player’s superiority to the average, while a negative Z-score, coloured in shades of red, indicates a value below the average. If a player is consistently in blue across their player cards, they will be ranked in the highest percentiles compared to their peers. If you would like to get familiar with the stats used in his work before diving in, please scroll to the bottom of the page to find a grid with all the necessary definitions.
Now that we’ve covered the basics, let’s dive right into the numbers!
Comparing Wright To His Competition
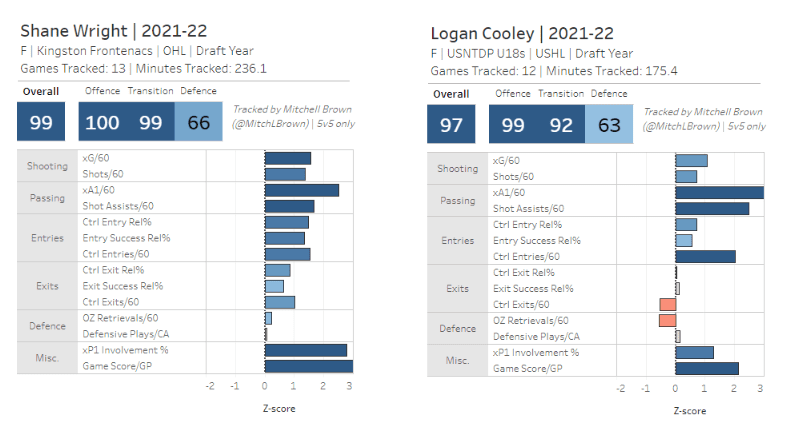
Below is a side-by-side comparison between Shane Wright and Logan Cooley, both of whom are likely to go in the top-3 of the 2022 NHL Draft. Immediately, what sticks out with these underlying numbers is that Wright is the more prolific goal-scorer (see the “Shooting” row), whereas Cooley looks like the better playmaker (see the “Passing” column). That being said, Wright tracks as a better playmaker than Cooley does a goal-scoring, giving Wright the edge in terms of diversified offensive output; making him less predictable.
Wright also projects as the better transition player (see “Entries” and “Exits”), as his success rates are notably higher than Cooley’s, which contributes to Wright’s 99th percentile ranking (seen at the top of the player cards). Although Wright doesn’t have as many controlled zone entries as Cooley has, largely due to Logan’s great speed on the rush, he is far more successful at exiting the defensive zone and entering the offensive zone. This is evidenced by the “CTRL Entry Rel%” and “Entry Success Rel%” rows, where you see a consistent sea of blue for Wright.
Although both seem to show a very comparable defensive impact, with Wright again edging out Cooley, it’s the offensive impact they have in relation to their team that is most telling. The last section, “Misc.” has the “xP1 Involvement%” and “GameScore/GP” metrics, both of which are used to measure the involvement of a player in the performance of the club as a whole. Most importantly, the “xP1 Involvement%” displays the percentage of the team’s total expected goals (xG) that the player either shot or set-up. In layman’s terms, this stat shows the percentage of offence generated by a player in relation to the rest of his team, and clearly, Wright generates a great deal more of the share of offence for his club than Cooley has for his.
Comparing The Top CHL Forwards
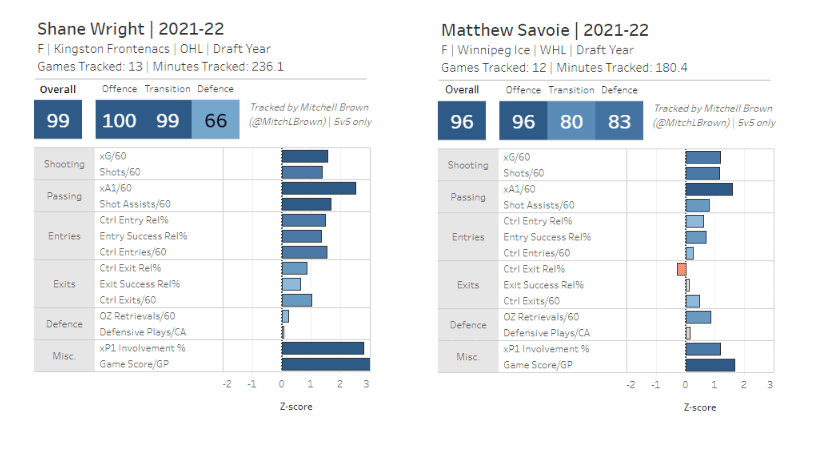
If we were to compare Wright to the 3rd highest ranked North American forward on Montreal Hockey Now’s Draft Rankings, Matthew Savoie, the discrepancies are even more striking. Despite being known as an all-out offensive player, Wright clearly outshines Savoie in every offensive category, while greatly trumping him in the transition categories. Despite playing on a dynamite Winnipeg Ice team in the WHL, Savoie doesn’t contribute the same percentage of offensive chances, nor the same number of offensive opportunities that Wright does (as evidenced by the “Misc.” section).
Wright ranks ahead in every offensive category, while being more vital to his club’s offensive success than Savoie, despite being tasked with far more defensive responsibilities on a given day. Savoies’ lack of transition prowess will likely see him eventually shift to the wing, which has already begun during the WHL playoffs in Winnipeg. In this comparison, Wright looks like the prototypical center, excelling at offensive generation, transition, and being more involved in his club’s offensive opportunity generation than almost anybody tracked in North America.
Such a side-by-side comparable could cool the idea of Montreal trading down to the 5th or 6th overall spot due to the players ranked in that range, such as Savoie or Jaokim Kemell, being comparable to Shane Wright.
Comparing Wright To A Current Montreal Canadiens Player
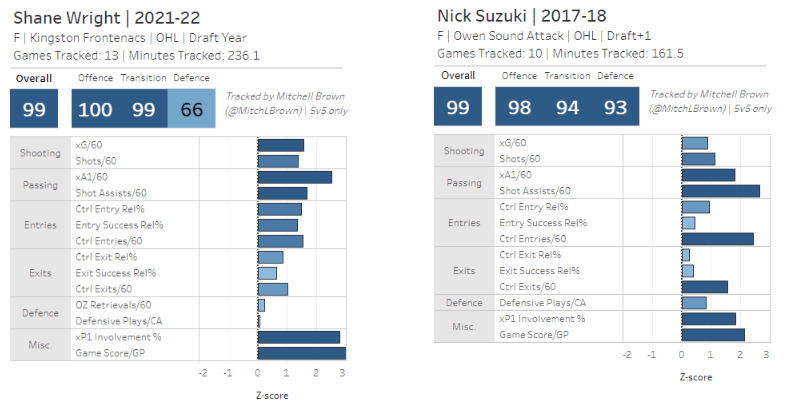
If Wright becomes the eventual selection at 1st overall, he’ll likely share top-6 duties with Nick Suzuki down the line for the Montreal Canadiens. Here’s a direct comparison between Nick Suzuki in his 18-year-old season and Shane Wright’s most recent 17-year-old season. You can immediately see that, even despite a drop in goals this season compared to his rookie season, Shane Wright is the better offensive player compared to Suzuki. He generated more goals, primary assists and was more efficient in transition than Suzuki was in his 3rd year in the OHL.
Suzuki was clearly superior defensively, being the more mature player at the time playing on Owen Sound’s second line. He attempted far more zone exits and zone entries than Wright, but wasn’t as successful at completing them. Wright’s offensive contribution in relation to his team far outweighs that of Suzuki’s with Owen Sound Attack, as the Attack had a much better overall team in 2017-2018 than the Kingston Frontenacs this season.
What this direct side-by-side comparison shows is that, despite missing a year of development, Shane Wright is currently a better offensive player today than Nick Suzuki was during his post-draft season and had the aptitudes to not only be as good as Suzuki at the NHL level, but one or two notches better. A combination of Wright and Suzuki down the middle for the Montreal Canadiens would be the foundational building blocks needed toward having two, top-end centers to lead a team toward sustainable success.
Clearly, Wright is one of the best players in this draft. Much can be said about the impressive performances of Logan Cooley and Juraj Slafkovsky internationally, but Wright’s impact on the game is undeniable when you compare to his peers. His contribution to the offensive generation and transition of a team, especially as a centerman, will likely prove too valuable to pass up for the Montreal Canadiens. Wright’s underlying numbers, attention to detail and growth as a player isn’t flashy, until you start to track him, game-by-game, and look for the details that set him apart from the rest of this class.
**To get more tracking content and get the latest information on the performance of North American prospects, head over to Mitch Brown’s Patreon today to subscribe!**
Below is a table giving full definitions for each of the major stats detailed in this article:
| Stat | Definiton |
|---|---|
| xG/60 | The weighted likelihood of a player's shots resulting a goal, based on shot location, shot type, preceding passes, situation, and rebounds |
| Shots/60 | The player's shots, rated per 60 minutes |
| xA1/60 | The weighted likelihood of a player's passes that resulted in a shot becoming a goal, based on shot location, shot type, preceding passes, and situation |
| Shot/assists | The immediate pass preceding a shot on goal, rated per 60 minutes |
| Ctrl Entry Rel% | The sum of a player's total controlled (carry or pass) entry attempts, divided by their total attempts, rated relative to team |
| Ctrl Entries/60 | The player's number of carries or passes over the offensive blue line to establish the offensive zone, rated per 60 minutes |
| Ctrl Exit Rel% | The sum of a player's total controlled (carry or pass) exit attempts, divided by their total attempts while pressured by the opposition, rated relative to team |
| Ctrl Exits/60 | The player's number of carries or passes over the defensive blue line, rated per 60 minutes |
| OZ Retrieval Success % | The player's number of puck retrievals (off dump ins) plus the number of steals and interceptions in the offensive zone, rated per 60 minutes |
| Defensive Plays/CA | The sum of a player's DZ break ups, slot pass interceptions, opposition shots that they pressured, neutral zone break ups, and recovered dump-ins in the defensive zone, rated per corsi against |
| xP1 Involvement % | The player's percentage of the team's total xG that the player either shot or set-up. |
| Game Score/GP | An all-encompassing metric that weights shot contributions, xP1, exits, entries, rush defence, and in-zone defence to measure impact, rated per game – used to measure volume, not efficiency. |